Paper originally published in the ASHRAE Journal Here: https://www.nxtbook.com/nxtbooks/ashrae/ashraejournal_RFGDOB/index.php#/p/30
Heating and cooling load calculations can take a substantial amount of time performing tedious material takeoffs as well as counting quantities of light fixtures, furniture, and equipment. Many architects and electrical engineers are already including some of this data in their Building Information Modeling (BIM) systems, or models, for their own purposes. Mechanical engineers can save time and reduce errors by identifying the relevant BIM data, validating its accuracy, overriding errors, and using the data for load calculations. This paper will discuss using BIM for load calculations, as well as validate the results of common BIM load calculation procedures against true measured loads on real life buildings and traditional calculation procedures so that BIM load calculations can be adopted with confidence.
Background:
Given how important space load calculations are to a mechanical engineer, and how much time they spend calculating these loads, it may be reasonably assumed that the mechanical engineer has some say in what the result is, but that assumption would be wrong. The mechanical engineer does not make any of the decisions that affect the load calculation. They do not decide wall constructions, window types, lighting power density or any other variable that has an impact on the result. When a mechanical engineer is “calculating loads”, they are essentially performing an accounting exercise. They are simply counting windows and lighting fixtures, measuring areas, and performing other accounting tasks, then manually typing the data into a load calculation engine.
Historically with pencil and paper or CAD, this was necessary. Part of the mechanical engineer’s job was to look at a line drawing of a window and understand that it was a window. Now, with BIM, that manual interpretation is no longer required because the model knows the element is a window because it is stored in a database as a window, along with the size, orientation, location, and ideally thermal properties.
The key to using BIM to quickly calculate loads is to identify, validate, and use the curated data and then override incorrect data as necessary. For example, the architect cares deeply about the size and location of all the windows in a model. If those items are not correct, the architect’s construction documents will not be correct. As such, the architect spends a significant amount of time ensuring correctness and therefore, much of the window data is curated. In most cases, however, the architect does not care about the thermal properties of the windows. In these cases, the window size and location data would be used, while the thermal properties would be overridden. An additional example of curated data would be lighting power. Efficient electrical engineers set the correct power on their lighting fixtures so that they can use BIM for panel scheduling.
The data that is curated in model is constantly improving. More and more electrical engineers are using BIM for panel schedules. With the adoption and enforcement of energy codes, a day may come when architects begin adding thermal properties to their models. In the meantime, BIM tools provide mechanical engineers efficient ways to validate data and then override data that they find objectionable.
Why use BIM for loads?
Using BIM for loads will allow you to design better mechanical systems quicker and more profitably, which will improve your company overall for the following reasons:
How does it work?
The intent of this paper is not to describe the process of actually running load calculations in any particular BIM software, but it is helpful to understand how the data ripples into a load calculation engine from its various BIM sources.
The fundamental building block of most BIM load calculation tools is what is called a spatial element. A spatial element is just like any other BIM element, it is geometry with data attached to it. The unique behavior of spatial elements is that the user does not define the geometry of a spatial element. The geometry of a spatial element acts like a balloon, the geometry expands until it hits a bounding element. A bounding element can be a wall, roof, floor, window, skylight, etc. Essentially, anything that can be a thermal barrier can be a bounding element. This balloon behavior allows the spatial element to pull in all of the areas and thermal properties of the elements that are bounding it. This is a particularly ingenious feat of software engineering; it cleans up “garbage in” so that you don’t get “garbage out”. If a spatial element is missing a section of exterior wall, the “balloon” will blow out of the opening and “explode”. The geometry of the space will become undefined and you will no longer be able to calculate loads on this space (no “garbage out”). Therefore, if a spatial element should have a 10 ft x 10 ft (3 m x 3 m) exterior wall, but only has a 6 ft x 10 ft (2 m x 3 m) wall due to an architectural modeling mistake, you will not be able to calculate loads on that spatial element. These mistakes do not happen frequently because architects use a spatial element called Rooms for their own purposes, such as building area programming, door schedules, and name/number tagging. Therefore, the architect typically curates the spatial elements.
The equivalent spatial element for MEP design is a Space. A Space is like the architectural Room, except the Room has architectural data attached to it and the Space has MEP data attached it.
Spaces aren’t just good for determining what is bounding them, they are also good at determining what is inside them. This is helpful when it comes to calculating internal loads. Spaces keep track of all of the electrical elements, such as light fixtures, that are contained inside the space. The space can read the electrical data from those elements and store it in the Space element. This allows you to have the same power that is on the electrical engineer’s panel schedule automatically show up in your load calculations. This also works with electrical receptacles; however, mechanical engineers typically account for plug load on an equipment level. They may prefer to override this receptacle power, but it is still a good quality check to be able to automatically compare the plug load assumed for the cooling load and the plug load that the electrical engineer assumed side-by-side.
There is not a “person” element in BIM software, so typically occupant load is derived from the Space Type Occupant Density parameter. Furniture, however, is often included in the model, so it is easy to automatically count the number of seats in the Space and compare that to the occupant density and select the most appropriate value.
Once all of this data is captured, it can be used in two ways. Most BIM software includes a built-in load calculation engine, but if a third-party engine is preferred, a Green Building XML (gbXML) file can be exported. gbXML is an extensible markup language (XML) database that is structured to an industry standard so that different software platforms can read and understand the data2. Both methods will be validated in the following sections.
Existing Validation Literature:
A seminar entitled “The Current State of the Art for an Automated Pathway from BIM Building Models Direct to HVAC Heating/Cooling Load Calculations” at the ASHRAE 2017 winter conference compared four different methods for calculating loads on the old ASHRAE headquarters located on Tullie Circle3. The first method was to use spreadsheets based on the RSTM method. The three other methods utilized BIM data. While the calculation results generally agreed with one another on a building level, they did not compare the results with a true measured building load. By validating our load calculation procedures against actual loads experimentally measured on a real-life structure, we can be more confident in utilizing BIM for loads.
Dr. Daniel E. Fisher and Dr. Jefferey D. Spitler at Oklahoma State University pioneered load calculation validation with their seminal research project ASHRAE RP-1117 entitled “Experimental Validation of Heat Balance/RTS Cooling Load Calculation Procedure”4. This research consisted of building two different 12 ft x 12 ft (3.7 m x 3.7 m) test facilities in Stillwater, Oklahoma (latitude = 36° 1’, longitude = -97° 1’). One test facility was built using heavy construction materials and the other was built using light construction materials. The thermal properties of the constructions can be viewed in Table 1. Both facilities were fitted with uncoated 1/8 in (3 mm) thick single pane windows (Normal SHGC = 0.86, U-Value = 1.04 Btu/h·ft2·°F (5.9 W/m2·K)) that accounted for 50% of the area of the south and west wall.
|
TABLE 1 Thermal Properties of Testing Facility |
||||||
|
Building Type: |
Walls |
Roof |
Floor |
|||
|
R-Value (h·ft2·°F/Btu) |
Thermal Mass (Btu/°F·ft2) |
R-Value (h·ft2·°F/Btu) |
Thermal Mass (Btu/°F·ft2) |
R-Value (h·ft2·°F/Btu) |
Thermal Mass (Btu/°F·ft2) |
|
|
Heavy |
6.24 |
27.93 |
16.13 |
4.61 |
4.16 |
3.66 |
|
Light |
19.86 |
2.13 |
11.96 |
1.27 |
2.92 |
2.66 |
No internal loads were added to the test facility because the heat gain procedure for internal loads is uncontroversial. Once they are quantified, they are simply added to the external gains. Including these heat gains in validation would only dilute the results.
A weather station was placed near the test facility to capture weather data. The weather on the test day was less severe than a typical design day for a September in Stillwater, the temperature ranged throughout the day from 63 °F to 85 °F (17.2 °C to 29.4 °C) while the global horizontal solar radiation peaked at 254 Btu/h·ft2 (800 W/m2). The solar radiation was not perfectly parabolic throughout the day due to some morning clouds, which would have suppressed the true load slightly.
The test facilities were instrumented, and the true loads imposed on the test facilities were measured. The investigators then calculated the loads on the test facility using the Heat Balance Method (HBM) and the Radiant Time Series Method (RTSM) and compared.
The true load of the test facilities, along with the calculated load and percent deviation from the true load can be viewed in Table 2. As expected, the computationally intensive HBM is more accurate than the simplified RTSM, which overestimated the true cooling load for the heavy building by 38.0% and the light building by 43.0% while the HBM underestimated the true cooling load for the heavy building by 7.9% and the light building by 1.17%.
It is important to note that the test facilities were designed to exaggerate the difference between the HBM and RTSM based on a study that confirmed the RSTM would always produce conservative estimates compared to the HBM and that the differences would increase as the fraction of window load increased5. The large area of inefficient windows (The current IECC code minimum window for south facing windows with no projection factor in Oklahoma climate zone 3A is Normal SHGC = 0.25 and U-Value = 0.55 Btu/h·ft2·°F (2.8 W/m2·K)) and the lack of internal loads combine to amplify the difference in the calculation procedures.
Additionally, while considered less accurate than the HBM, the RTSM allows the users to calculate and view the loads attributed to each source which is helpful when analyzing results and comparing with historical knowledge of typical loads.
BIM Validation:
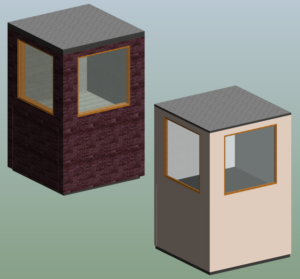
In order to validate BIM load calculations, we created a BIM model of the experimental facilities used in RP-1117, which can be viewed as Figure 1. The appropriate thermal properties were applied to the bounding elements. Spaces were placed and the value of the internal loads were overridden to zero.
Figure 1: Model of heavy construction (left) and light construction (right) test facility.
We then performed load calculations using three different commonly available BIM load calculation procedures. First, we used Revit’s built-in load calculation tool, which is an RTSM engine6. Then, we exported a gbXML file from Revit and imported it into Trane Trace 700. We calculated loads using the default TETD-TA1 engine, which is a total equivalent temperature difference engine7. Finally, we used the RTS (Heat Balance) engine in Trace 700, which calculates the space solar and nonsolar radiant time series values based on the rigorous heat balance method described in the 2001 ASHRAE Fundamentals Handbook. The RTS (Heat Balance) engine also accounts for the amount of solar gain lost through retransmission back out of windows8. Trace 700 does not import construction types from gbXML9, so the thermal properties had to be rebuilt in Trace 700.
|
TABLE 2 Heating and Cooling Sensible Load Results |
|||||||||||
|
Building Type: |
RP-1117 Loads |
BIM Loads |
Trane Trace 700 |
||||||||
|
True Measured Load (Btu/h) |
Heat Balance Method (HBM) |
Radiant Time Series Method (RTSM) |
Revit Built–In Loads Tool (RTSM) |
Default Methodology (TETD-TA1) |
RTS (Heat Balance) Method |
||||||
|
Load (Btu/h) |
Error |
Load (Btu/h) |
Error |
Load (Btu/h) |
Error |
Load (Btu/h) |
Error |
Load (Btu/h) |
Error |
||
|
Heavy |
9,330 |
8,595 |
-7.9% |
12,875 |
38.0% |
12,626 |
35.3% |
11,942 |
28.0% |
9,337 |
0.1% |
|
Light |
11,875 |
11,735 |
-1.2% |
16,981 |
43.0% |
16,556 |
39.4% |
16,332 |
37.5% |
13,561 |
14.2% |
In each case the weather files were modified to account for the actual testing weather conditions and to force the peak load to occur in September so that the solar angles matched the test day. Given the limitations on how weather files can be entered into both Trace 700 and Revit, we were unable to account for the slightly cloudy morning of the test day, so both engines will slightly overestimate the true solar radiation.
The results of the calculations can be viewed in Table 2. Revit’s built-In load calculation tool, which uses an RTSM, method overestimated the cooling loads in the heavy building by 35.3% and the light building by 39.4%, this is approximately the amount of overestimation from the RTSM methods used in RP-1117 conducted by Dr. Fisher and Dr. Spitler. The default Trane Trace 700 engine overestimated the true tested loads in the heavy building by 28% and the light building by 37.5%. The Trane Trace 700 RTS (Heat Balance) engine was the most accurate engine, overestimating the heavy building by only 0.1% and the light building by 14.2%.
While these may seem like overly conservative results, remember that the test was set up to exaggerate the inaccuracies of the RTSM. All results generally agree with the results of the RP-1117 calculations.
Extrapolation to A More Likely Scenario:
Now that we’ve validated the BIM load calculations for the exaggerated scenario, we can remove the parameters that exaggerate the difference between the RTSM and HBM in order to determine what a more realistic scenario would look like.
We modified the thermal properties of the materials to represent a 2012 IECC code minimum construction for Oklahoma climate zone 3A as well as added internal loads indicative of a modern office environment, including 340 Btu/h (100 W) of lighting load, 170 Btu/h (50 W) of plug load, and 275 btu/h (80 W) of sensible person load. We then calculated loads using 2017 ASHRAE climatic design data for Stillwater regional airport.
As expected, the results from all three methods converged to a much more reasonable difference. All results were within about 12% of the average. The results can be viewed in Table 3.
|
TABLE 3 Extrapolation Results |
|||||||
|
Building Type: |
Average of all three methods (Btu/h) |
BIM Loads |
Trane Trace 700 |
||||
|
Revit Built–In Loads Tool (RTSM) |
Default Methodology (TETD-TA1) |
RTS (Heat Balance) Method |
|||||
|
Load (Btu/h) |
% Difference From Average |
Load (Btu/h) |
% Difference From Average |
Load (Btu/h) |
% Difference From Average |
||
|
Heavy |
8,266 |
7,980 |
–3.46% |
8,689 |
5.12% |
8,129 |
–1.66% |
|
Light |
8,362 |
9,313 |
11.37% |
8,333 |
–0.35% |
7,439 |
–11.04% |
Conclusion:
BIM load calculations have proven to be comparable to traditional methods of calculating loads. Whether you prefer the accuracy of the HBM or the analysis capabilities of the RTSM, commercially available BIM software and plugins have a solution that will work for you.
Using BIM to calculate accurate cooling loads faster and with fewer errors is a viable path for our industry. It will improve profitability, help retain talent, and allow better systems to be designed.
References: